Online Debugging
You can debug and test registered devices in Device Connectivity & Management online to quickly locate problems or to facilitate application development.
Supported Device Types and Functional Scope for Debugging
- Real Devices: Refers to devices that are currently activated, connected to EnOS, and in an Online status. Only the following downlink operations are supported for real devices from the cloud:
- Measurement Point Debugging: Retrieve the latest value of a data point or issue a command to set the data point value.
- Service Invocation: Issue a command to invoke a device service and retrieve the device's execution status log.
- Virtual Devices: Refers to devices in EnOS that are in an Inactive or Offline status. Virtual devices can simulate a connection between a real device and the cloud, allowing you to simulate both uplink and downlink operations from the cloud, including:
- Attribute Reporting: Simulate the device reporting attribute values.
- Measurement Point Reporting: Simulate the device reporting real-time data point values.
- Measurement Point Debugging: Retrieve the latest value of a data point or issue a command to set the data point value.
- Service Invocation: Issue a command to invoke a device service and retrieve the device's execution status log.
The attributes, points, and commands supported by a device, as well as whether data point values can be set, are determined by the device’s model. For more information, see Model and Asset Modeling.
Prerequisites
Ensure that you have obtained the Developer role to have the access to Application Portal > Developer Console. If not, contact your OU administrator.
Debugging Device Data
In the Developer Console of EnOS Application Portal, select Operation Monitoring > Online Debugging.
Select the Product to which the device belongs, then choose the Device you want to debug.
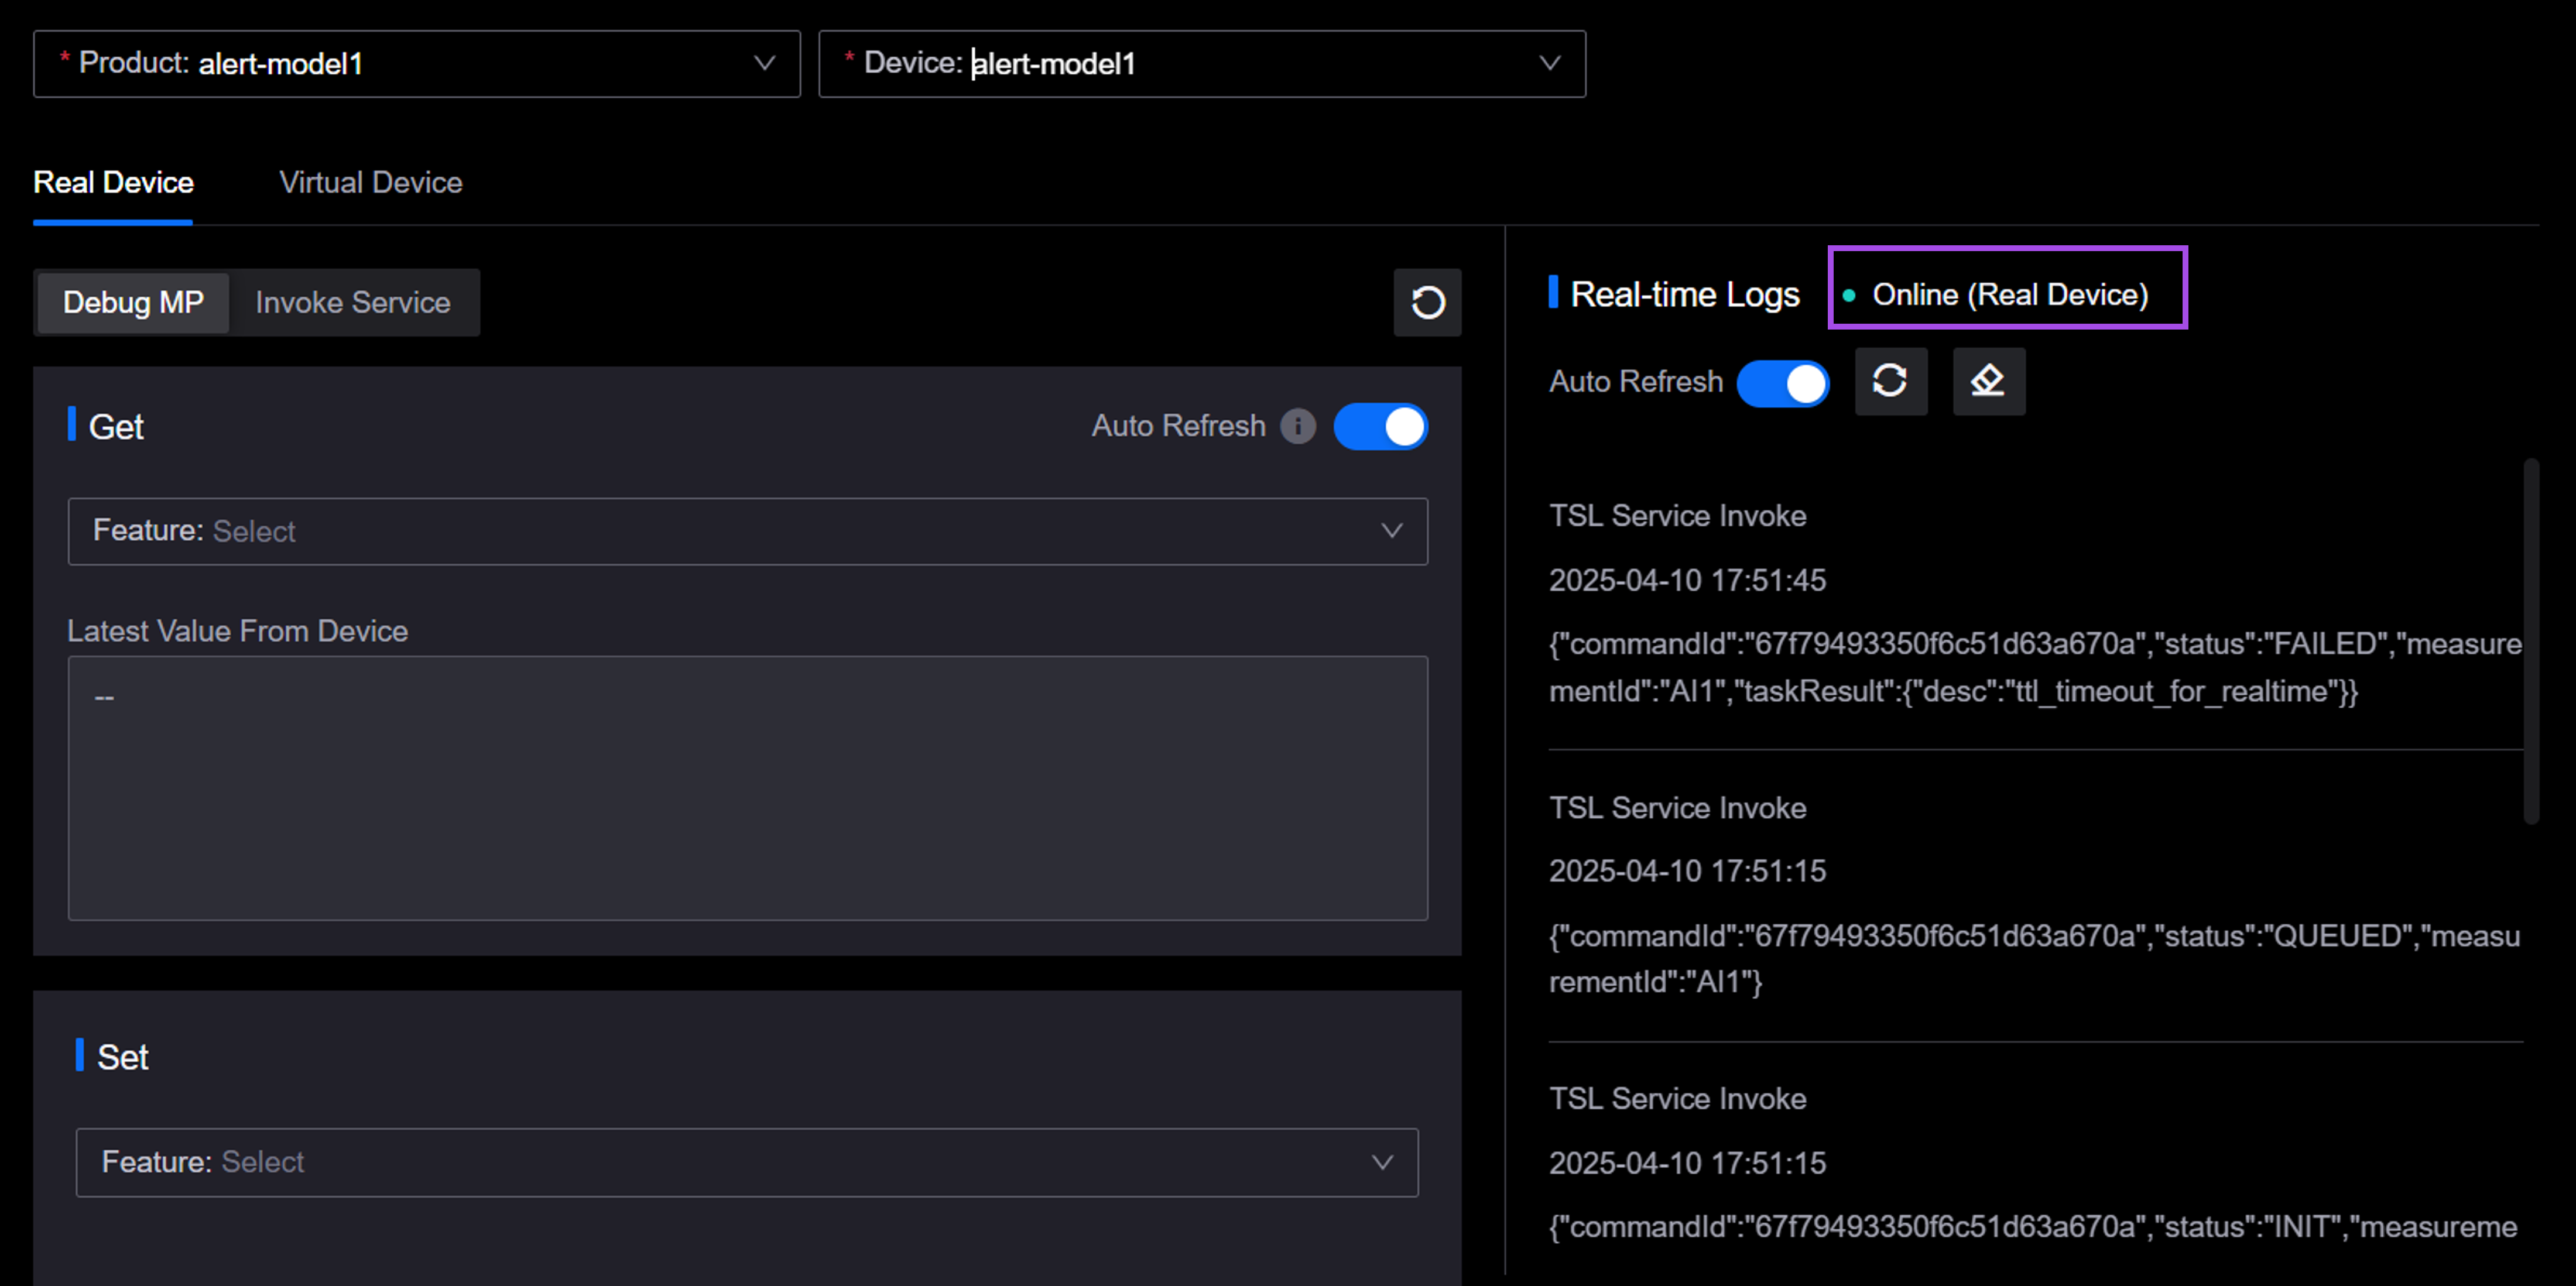
Check the current status of the device on the right side.
If the device is in an Online status and is a Real Device, go to the Real Device tab.
If the device is in an Inactive or Offline status, or is displayed as a Virtual Device, go to the Virtual Device tab. If the virtual device is not currently enabled for the device, you need to click Activate Virtual Device first.
You can also go to Device Management > Device Assets to view the status of all devices in the current OU. For more information, see Viewing Device Status.
Perform the following operations based on the device you need to debug.
Debugging Measurement Points
Getting Point Latest Data
You can retrieve the latest value of a single data point for a device from the cloud. This feature is applicable to both real devices and virtual devices.
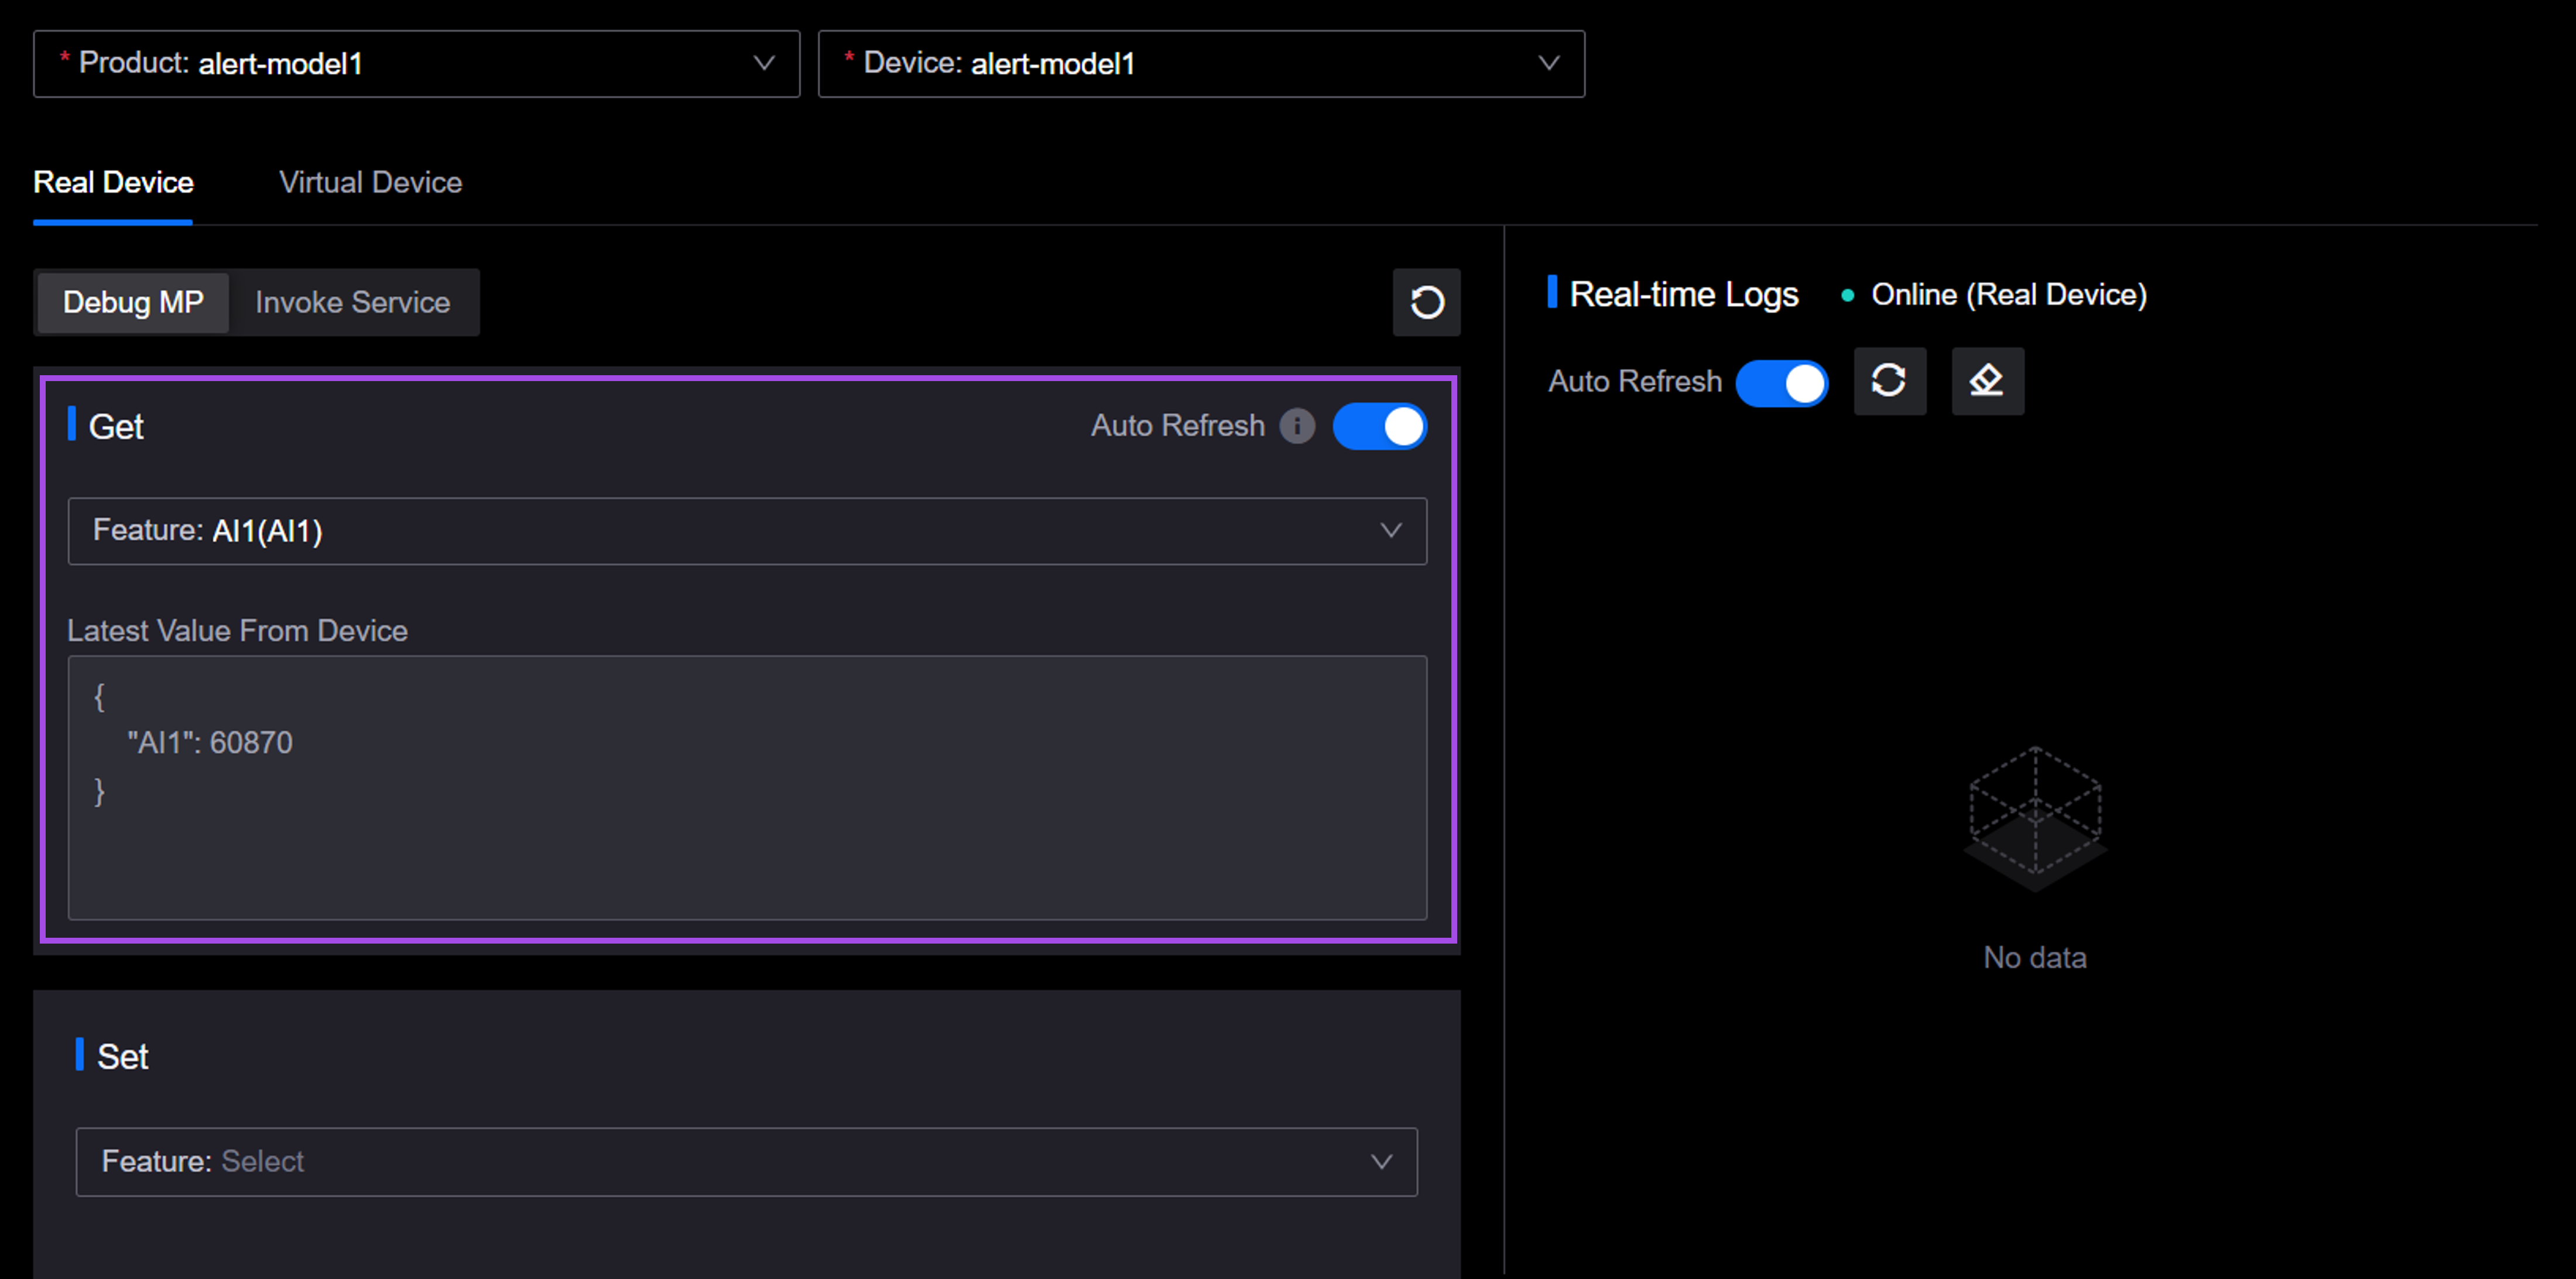
On the Real Device or Virtual Device tab, click Debug MP, and select a data point from the Feature dropdown list under Get.
Turn on the Auto Refresh switch, and the retrieved data will be displayed in the Latest Value From Device field, refreshing every 10 seconds. There will be no real-time logs on the right side.
The current value will be synchronously updated in Device Management > Device Assets, and you can view it on the Measurement Points tab of the device details page. For more information, see Viewing Device Data.
Setting Measurement Points
You can set the value of a data point from the cloud. The complete process for this feature is as follows: First, a “set data point value” command is sent from the cloud to the device; the device then receives and responds to this command. This feature is applicable to both real devices and virtual devices.
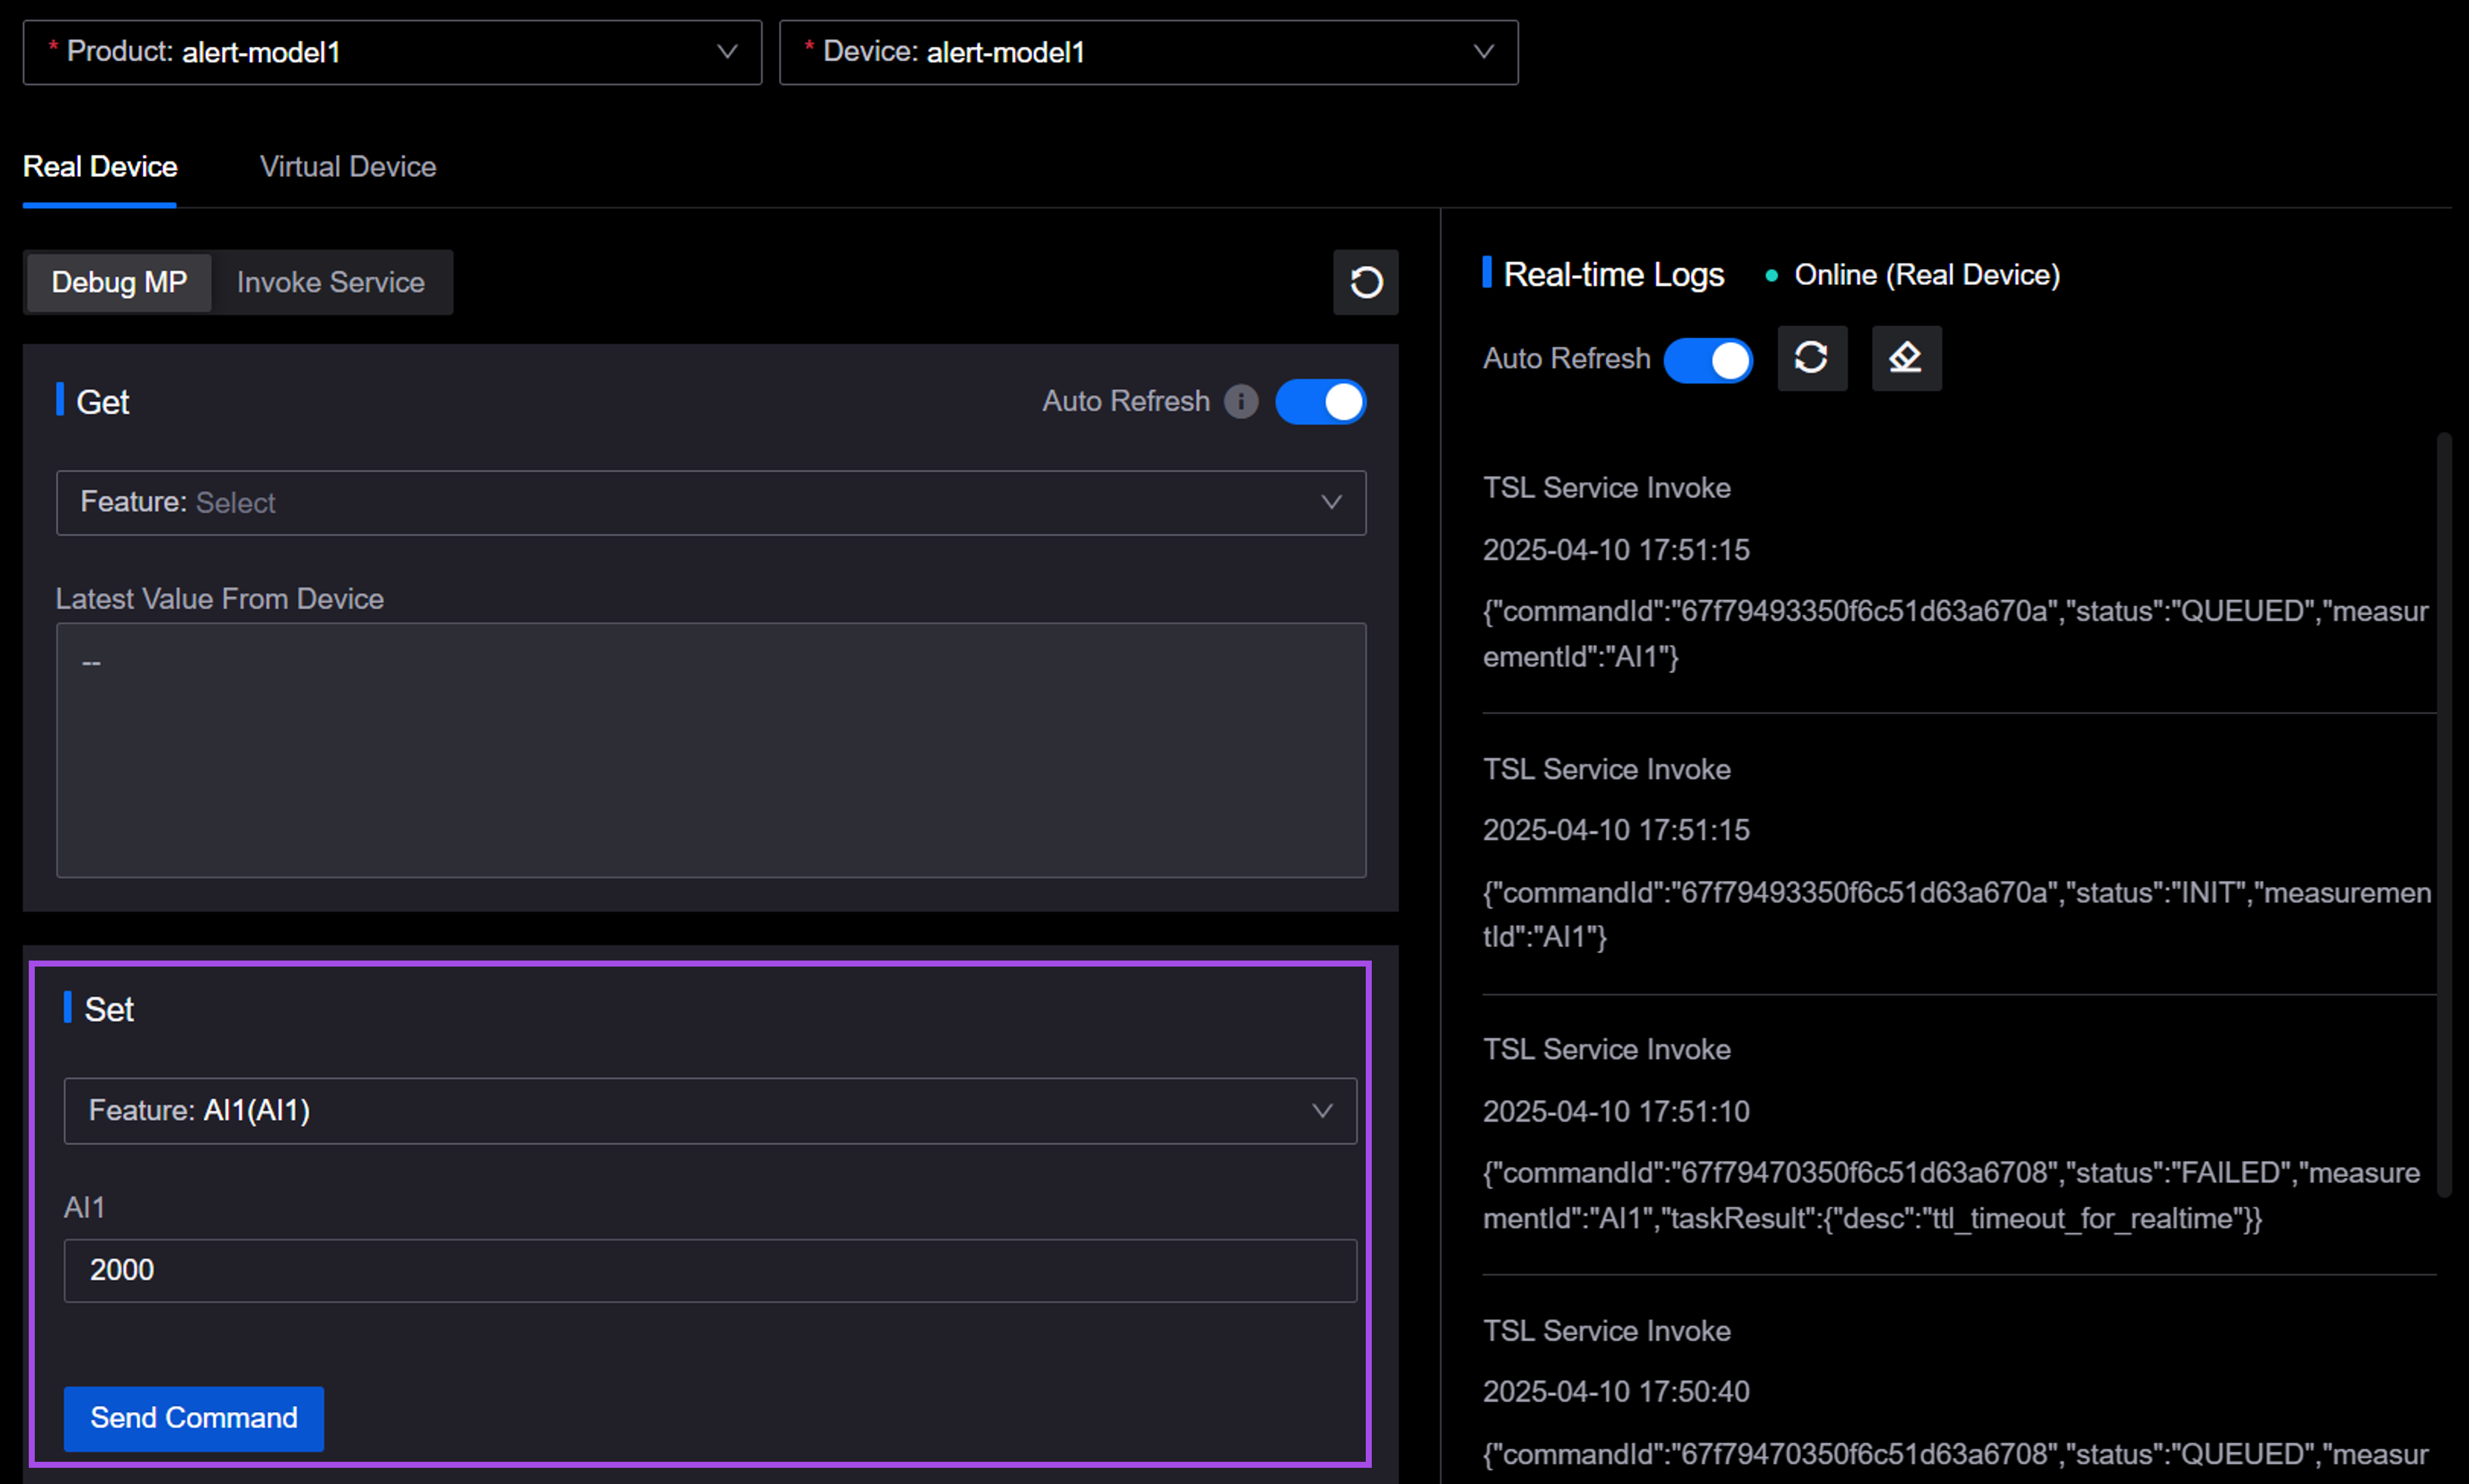
On the Real Device or Virtual Device tab, click Debug MP, and select a data point from the Feature dropdown list under Set.
Based on the data type of the data point, enter the desired value for the data point in the input box.
Click Send Command. After a successful setting prompt, the corresponding logs from the cloud and device sides will be displayed on the right, with the latest log at the top. Taking the figure below as an example, the logs include the following parts:
TSL Service Invoke: The cloud initiates a command aimed at setting the value of the AI1 data point. This is the starting point of the process, indicating that the system has begun handling the request.
Cloud-to-Device Command: The cloud sends a specific instruction to the device, requesting the AI1 data point value to be set to 2000.
TSL Service Invoke: The command has been successfully issued to the device, indicating that the cloud has sent the instruction and is awaiting the device’s response.
Device-to-Cloud Command: The device receives the command and executes it successfully, returning a status code of 200 and the message “success,” indicating that the AI1 data point has been set to 2000.
TSL Service Invoke: The entire task is completed, with the cloud confirming that the device has successfully executed the command. The
taskResultcontainingcode: 200anddesc: successfurther validates the success status.
Since this is a command sent from the cloud to the device rather than a data point value reported by the device, if the device does not send the updated data point value back to the cloud, the latest value of the data point viewed in the cloud will not change.
The issuance and execution status of this command will be synchronously updated in Device Management > Device Assets, and you can view it on the Commands tab of the device details page. For more information, see Viewing Device Data.
Invoking Services
You can issue a command to invoke a device service and retrieve the device’s execution status log. This feature is applicable to both real devices and virtual devices.
On the Real Device or Virtual Device tab, click Invoke Service, and select a service from the Feature dropdown list.
Based on the data types of the input parameters listed for the selected service, enter the parameter values in the input box.
Click Send Command. After a successful invocation prompt, the corresponding logs from the cloud and device sides will be displayed on the right.
The issuance and execution status of this command will be synchronously updated in Device Management > Device Assets, and you can view it on the Commands tab of the device details page. For more information, see Viewing Device Data.
Reporting Attributes
You can simulate the reporting of attribute values from a device. This feature is only applicable to virtual devices.
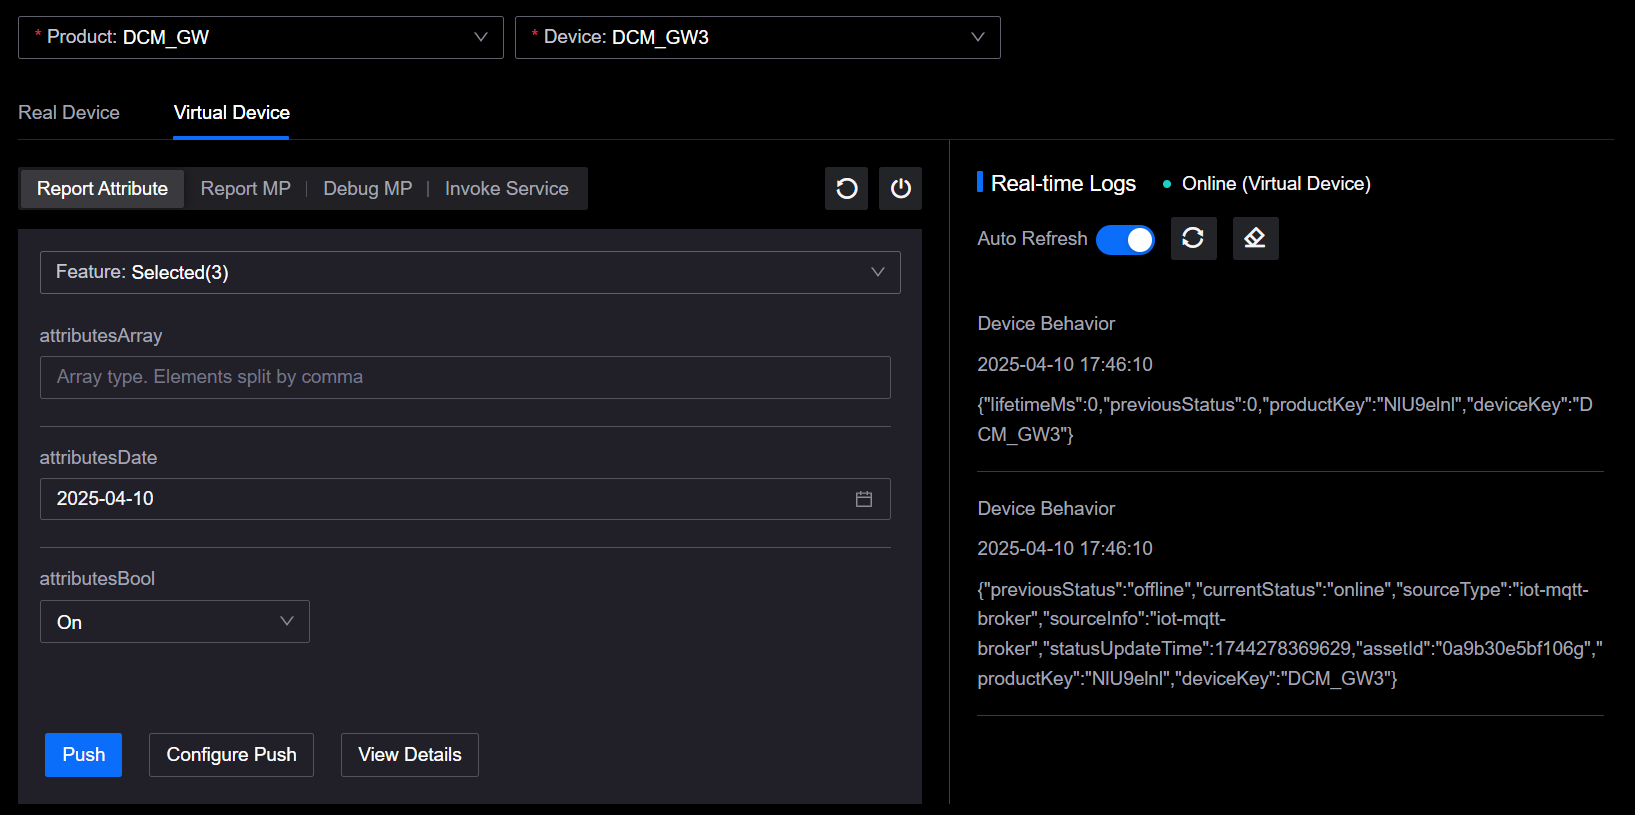
On the Virtual Device tab, select the Attribute Reporting tab, and choose one or more attributes from the Feature dropdown list.
Based on the data type of the attributes, enter the attribute values in the corresponding input boxes.
Click the Push button to report the attribute values, or select Configure Push to configure a timed push schedule or frequency for multiple pushes. After a successful report, the corresponding logs for the reported attributes will be displayed on the right.
Since this is an attribute report from the device to the cloud, the attribute values will be synchronously updated in Device Management > Device Assets. You can click View Data on the page to jump to the Attributes page of the device and view the latest attribute values.
Reporting Measurement Points
You can simulate the reporting of data point values from a device. This feature is only applicable to virtual devices.
On the Virtual Device tab, select Measurement Point Reporting, and choose one or more data points from the Feature dropdown list.
Based on the data type of the data points, enter the data point values in the corresponding input boxes.
Click the Push button to report the data points, or select Configure Push to configure a timed push schedule or frequency for multiple pushes. After a successful report, the corresponding logs for the reported data points will be displayed on the right.
Since this is a data point report from the device to the cloud, the data point values will be synchronously updated in Device Management > Device Assets. You can click View Data on the page to jump to the Measurement Points page of the device and view the latest data point values.
Other Actions
On the Real Device or Virtual Device tab, you can also perform the following operations on debugging data:
Reset Debugging Data: Click the Reset
 button to reset the entered debugging data.
Shut Down Virtual Device: Click the Close
 button to shut down the virtual device. After shutting it down, you can still restart the virtual device.
Refresh Real-Time Logs: The Auto Refresh switch is enabled by default. You can also click Refresh
 to manually refresh the real-time logs.
Clear Real-Time Logs: Click the Clear
 button to clear the real-time logs displayed on the right.