Key Concepts
This article introduces the key concepts you need to know about DTV.
Data Source
A Data Source in DTV serves as an integrated channel to connect various data providers, supplying the necessary data for the application pages. DTV encapsulates the logic of retrieving data from diverse origins, allowing application developers to configure and use data through a unified interface without dealing with the underlying complexities of data acquisition.
Based on whether the data originates from EnOS, DTV classifies data sources into:
Built-in Data Sources: Data from EnOS, such as time-series data stored in EnOS or registered metric data.
External Data Sources: Data from external systems, such as static data uploaded via CSV files or third-party data fetched through APIs.
Through Data Sources, application developers can flexibly integrate multiple types of data and request data for the widgets directly from these sources, enabling the rapid development of dynamic visual applications. For more information, see Data Source Overview.
Model
A Model in DTV abstracts the common characteristics of a category of assets—such as attributes, measure points, and services. For more information about creating models, refer to EnOS Model Management.
In DTV’s data configuration, selecting a specific model means targeting a collection of asset data sharing the same characteristics. For example, if you select a “PV Inverter” model for a widget, it can request and display real-time status, historical time-series data, or alarm information from all PV inverter assets belonging to that model.
Dataset
A Dataset in DTV refers to the categorization and encapsulation of data collections with unified structures from data sources. Application developers can customize request parameters and return structures for the datasets, defining clear data boundaries for the widgets.
Datasets enhance the flexibility and business adaptability of Data Sources. When a Data Source lacks a default structure or its default structure fails to meet business requirements, developers can create datasets to customize filtering conditions, parameter combinations, and return fields. This enables precise alignment with the needs of different widgets.
Dashboard
A Dashboard is one of the core types of DTV pages designed for centralized monitoring and data analysis. By flexibly arranging multiple widgets on a single page, it provides end users with a holistic view of key business metrics and data.
The core value of a Dashboard lies in its ability to integrate and present multi-source data, enabling end users to quickly grasp business status, identify trends, and make timely decisions. It is commonly used in data visualization scenarios such as real-time monitoring, operational analysis, and performance reporting.
Single-Page Application
A Single-Page Application (SPA) is a composite visual application that integrates multiple visual pages (including DTV Dashboards and third-party pages) within a unified interface through a structured navigation framework. It enables end users to dynamically link pages and data using navigators such as filters and tabs, delivering an integrated and contextually coherent data analysis experience.
SPA is ideal for complex business scenarios, such as building multi-domain asset operation platforms or energy monitoring dashboards. It leverages navigators for page switching and data filtering, and organizes content through canvases, layers, and panels, forming a structured, interactive, and unified data workspace. This helps end users efficiently perform cross-page monitoring and analytical tasks.
The following illustrates the SPA’s components:

Canvas
Canvas is the foundational unit of the SPA that hosts visual content. Each Canvas represents an independent scenario or data perspective, accommodating one or more layers to manage the layout and display of various widgets and elements.
When the end users change filter conditions or move from one tab to another via a Navigator, they switch the underlying linked canvases and layers, dynamically updating the content and data scope of the entire page. This design enables SPAs to integrate multiple data scenarios within a single view, delivering a coherent and in-depth data exploration experience.
Canvases are categorized into two types to accommodate diverse visualization needs:
Single-Layer Canvas: All widgets reside on the same level, with a layout similar to the Dashboard pages. It is ideal for building most data dashboards and analytical pages.
Multi-Layer Canvas: Supports stacking and management of multiple layers, enabling the construction of complex pages with spatial hierarchies. For example, a map widget can serve as the background in the base layer, while a layer hosting data chart is overlaid above it. This multi-layer structure facilitates interactive data drilling and analysis through layer linkages.

Layer
A Layer is a logical unit within a Canvas used for hierarchical management and display of content such as widgets and elements. It divides the canvas into multiple levels, with each level independently hosting visual content for different purposes. For end users accessing the application, layers themselves are invisible, but the content across layers is superimposed and displayed according to their visual hierarchy, collectively forming a complete view.
Layers enable content separation and detailed control in SPA. By placing different types of widgets on different layers, application developers can:
Create visual hierarchy in the presentation of elements, e.g., placing a map at the bottom layer with charts floating above it.
Independently manage the styles, data, and interactive behaviors of widgets within each layer.
Build comprehensive monitoring interfaces with spatial depth and complex interactions, such as GIS map monitoring, or process flow maps.
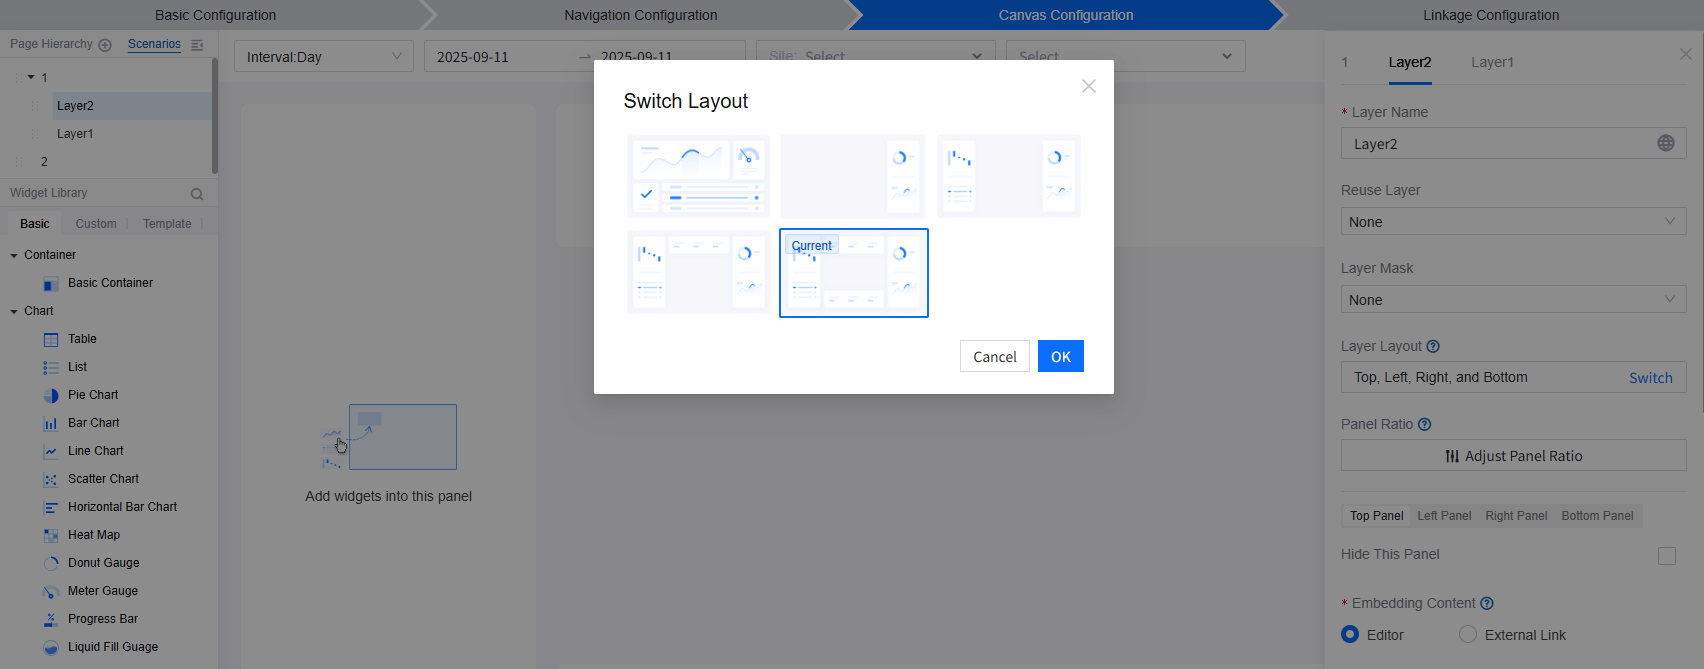
Layers must be placed on a Canvas, and a single Canvas can accommodate up to two layers. The position and dimensions of content within each layer are determined by the layout, such as Left & Right layout or Top, Left, Right, and Bottom layout.

Panel
A Panel is what forms the layout of layers. It is a rectangular area on the canvas designed to host and display final content. Panel determines the precise position and dimensional boundaries of the widgets or the embedded external pages within the Layer. A single Layer may contain multiple Panels, whose sizes and positions are defined by the Layer Layout.
Panels provide display windows for different content within a Layer. You can add content to a Panel in the following two ways:
Embed in Editor: Add and configure widgets within the panel to flexibly construct data visualization interfaces.
Insert External Link: Embed existing third-party webpages or applications via URL to quickly integrate external resources and achieve seamless content fusion.
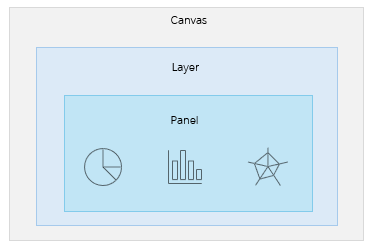
In summary, the Canvas serves as the foundational container, the Layer manages hierarchies, and the Panel acts as the specific “frame” within each layer that resides the displayed content. The relationship between these three components is illustrated in the following diagram. They collectively form the flexible and powerful page construction system of the SPA.

Widget
Widget is the fundamental functional unit in DTV for building dashboards and SPAs. Each widget possesses specific data presentation or interactive capabilities. Application developers can add widgets via simple drag-and-drop, configure the widgets, and combine them to form complete pages.
Based on their functions and purposes, widgets are primarily categorized into the following types:
Charts: Designed for data visualization, including line charts, bar charts, pie charts, indicator cards, tables, etc. They present data graphically to help end users quickly grasp data trends, distributions, and key metrics.
Containers: Used to hold and manage other widgets, enabling structured typesetting and hierarchical composition of pages. Containers do not directly display data but serve as auxiliary units for organizing interfaces and controlling widget display logic.
By combining charts and containers, application developers can flexibly construct a wide range of visual interfaces, from simple data dashboards to complex business monitoring systems. For more information, see Common Configurations for Widgets.
Filter
A Filter is a functional component in DTV that enables data filtering and cross-component linkages. It allows end users to dynamically set filter conditions on the Runtime Interface, thereby refining the data content displayed in one or multiple associated widgets.
Filters provide page-wide or widget-specific control over data interactions, transforming static pages into dynamic and interactive data dashboards. By modifying filter conditions, end users can instantly switch data perspectives and focus on critical information without reconfiguration or coding. This functionality is commonly used to build interactive dashboards and comprehensive analysis pages, significantly enhancing the flexibility and efficiency of data exploration.
Linkage 
Linkage is the core mechanism that enables intelligent data exploration in SPAs, specifically referring to the dynamic responsive relationships established among Navigators, Canvases, and Widgets. Linkage rules enable end-users’ actions on the Runtime Interface (e.g., selecting filter conditions, switching tabs) to automatically trigger coordinated changes in backend data flow and frontend views, delivering a unified interactive experience.
Based on their targets and effects, linkages are categorized into the following types:
Canvas Linkage: Establishes display logic between the Navigator and the Canvases. When the end users modify filtering conditions via the Navigator, they will be presented with the corresponding Canvas.
Data Linkage: Creates a data channel between the Navigator and the Widgets. It transmits parameter values specified by end users in the Navigator to the Widgets on the Canvas in real time, serving as data query conditions to drive dynamic updates of the widget content.
Widget Linkage: Defines linkage rules between the Widgets. When an end user performs a triggering action in one Widget, the linked Widgets will display data matching the specified conditions.
Linkage configuration transforms SPAs from static pages into intelligent multi-page tools that efficiently perform multi-source data analysis. It is a key technical means for building a unified data workspace capable of managing complex business operations.
DTM
Digital Twin Monitoring (DTM) is a visualization page type in DTV designed for industrial scenarios, graphically presenting the real-time status of the equipment, processes, and systems. Typically built using vector graphics such as SVG, DTM supports dynamic binding of graphical elements to real-time data, enabling dynamic mapping and monitoring of physical entities (e.g., devices, pipelines, instruments) and their operational processes.
DTM integrates complex industrial data with visual process blueprints, delivering a monitoring experience that closely mirrors the physical environment. DTM IS commonly used to build industrial visualization applications such as process flow monitoring, equipment status display, and factory topology management, to help operation and engineering personnel quickly grasp system status and identify issues.
Form
A Form is one of the DTV page types. It is designed for data entry, parameter configuration, and business process operations. By providing rich input controls such as text fields, dropdown lists, and buttons, a Form page enables end users to submit or modify data in the system. This then triggers the flow of business logics in the backend or the processing of work orders.
The core function of a Form is to connect user actions with data updates, delivering a flexible interaction interface for business processes. Forms are commonly used to build interactive applications for data entry, work order dispatch, parameter setting, approval workflows, etc. They help business users efficiently complete data maintenance and task processing.